Introduction
About Fruits360
Product Overview
Purpose of this Document
Key Features and Benefits
Insights:
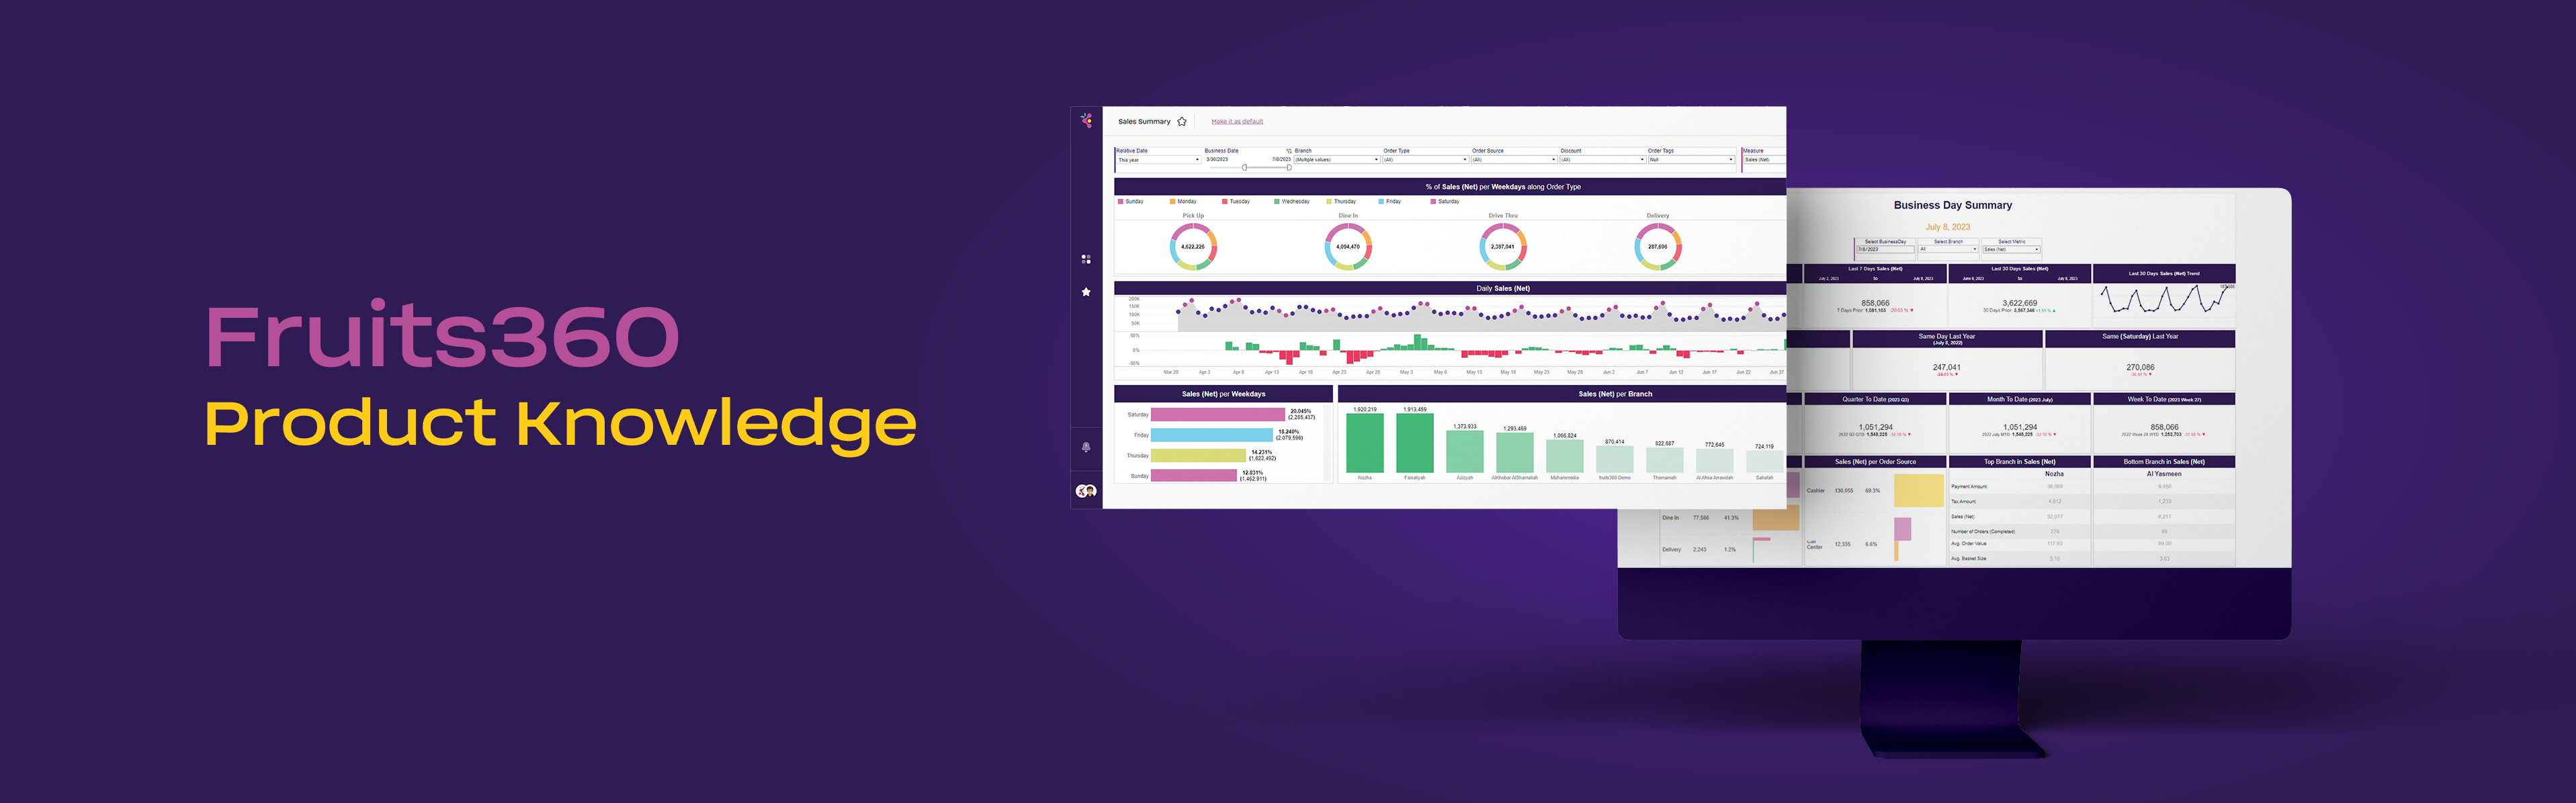
- Executive Summary: This provides a snapshot of the most crucial restaurant metrics, allowing executives to track their performance in one comprehensive report.
- Business Day Summary: Shows restaurant managers how their business performed on a specific day, letting them compare this performance to previous periods.
Insights:
- Sales Summary: You can see your restaurant’s sales and orders and filter them by different criteria to understand how well your business is doing. It gives you a complete picture of your sales performance.
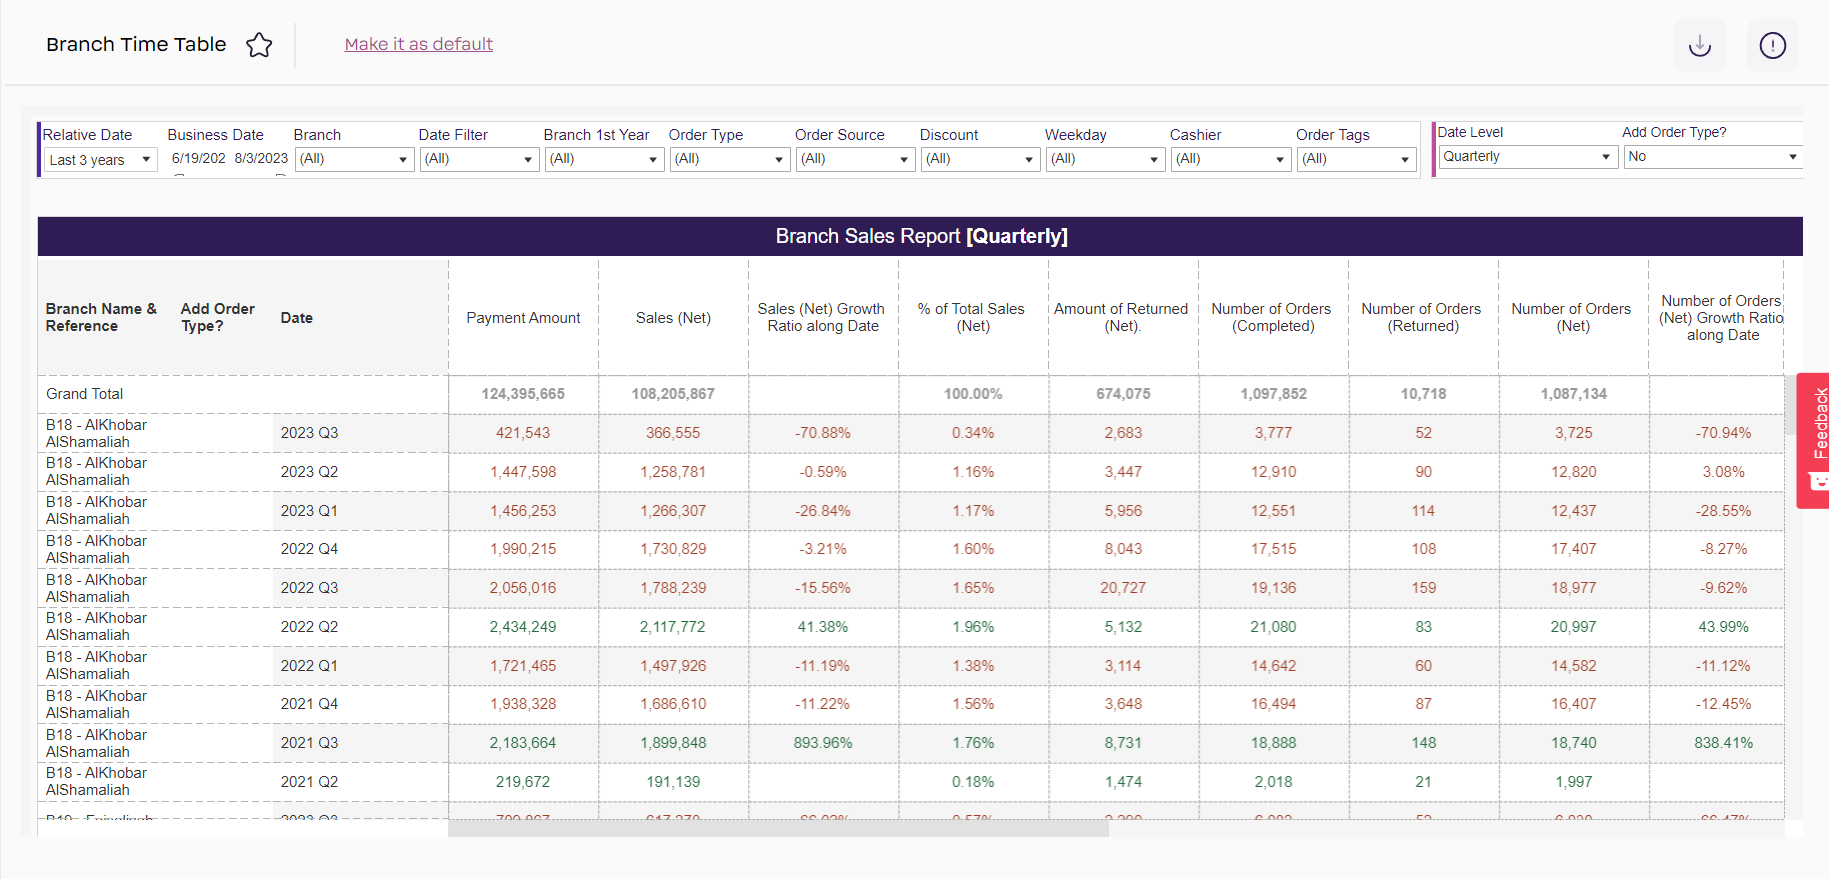
- Branch Time Table: Branch Time Table details the performance of a restaurant branch, providing a comprehensive analysis to improve performance and increase profitability.
- Aggregator Performance Analysis :Aggregator Branch Trends allows restaurant managers to compare and evaluate different online delivery apps between branches.
Insights
- Menu Engineering: Menu Engineering insights provide visibility of menu items’ profitability, popularity and purchase behavior to maintain a profit-focused menu. The Product Cluster report visually categorizes menu items into Stars, Horses, Puzzles, and Turtles based on their popularity and profitability.
- Market Basket Analysis: Market Basket Analysis offers a comprehensive understanding of the connection between restaurant products, branches, and their associations, allowing for branch-level comparisons and revealing significant associations between products to enable successful promotional bundles.
- Customer Analytics: One of the paramount insights facilitating the restaurant’s comprehension of client behavior involves discerning customer preferences and aversions within their orders. Furthermore, the ability to segment clients is enhanced through the identification of loyal patrons and an assessment of their visit frequency.”
Insights
- Branch Performance Analysis: The branch performance analysis report provides insights on how each branch performs across different order channels, including basket size, net sales, and other metrics. It helps in the positioning of each branch and what branches are showing red flags and need immediate intervention something like that.
- Cash Control: The Cash Control report provides information on shortages and surpluses, as well as the accuracy of individual cashiers, to prevent fraud and manipulation in a restaurant business. It helps owners identify which cashiers have the biggest shortages and take necessary actions to improve their accuracy.
- Workforce Distribution/ Calendar KPI Tracker: The Calendar report shows the sales behavior over the year, including peak months, and assists with workforce distribution and marketing by identifying low seasons.
- Product Seasonality: The Product Seasonality report is a helpful report to identify seasonal trends for specific items based on their sales data sorted by month. It can be used to make informed decisions on menu offerings, promotions, and inventory management to better meet customer demand.
Insights
- Inventory Time Table: With the Inventory Time Table report, you can track all incoming and outgoing inventory data, such as production, purchasing, returns, transfers, consumption, supplier returns, outgoing transfers, and waste over different time periods, including years, quarters, months, weeks, and days. This report also allows you to select specific branches or items and presents the data on different date levels, making it easier for you to track your inventory and make data-driven decisions.
- Daily Stocktaking Summary: The Daily Stocktaking Summary is a tool that helps people keep track of how much inventory they have. It shows how much they should have received, how much they actually received, and if there are any differences. This helps them see if there were any problems with receiving items, shortages, or waste. It also allows them to see how much inventory each branch has on a specific day.
- Inventory Waste: The Waste Summary report shows how much waste a restaurant has over time and how much it costs per branch and per item. By tracking this information, restaurants can identify problematic trends and use other inventory insights to make decisions that will increase their profits and overall success.
Technical Specifications
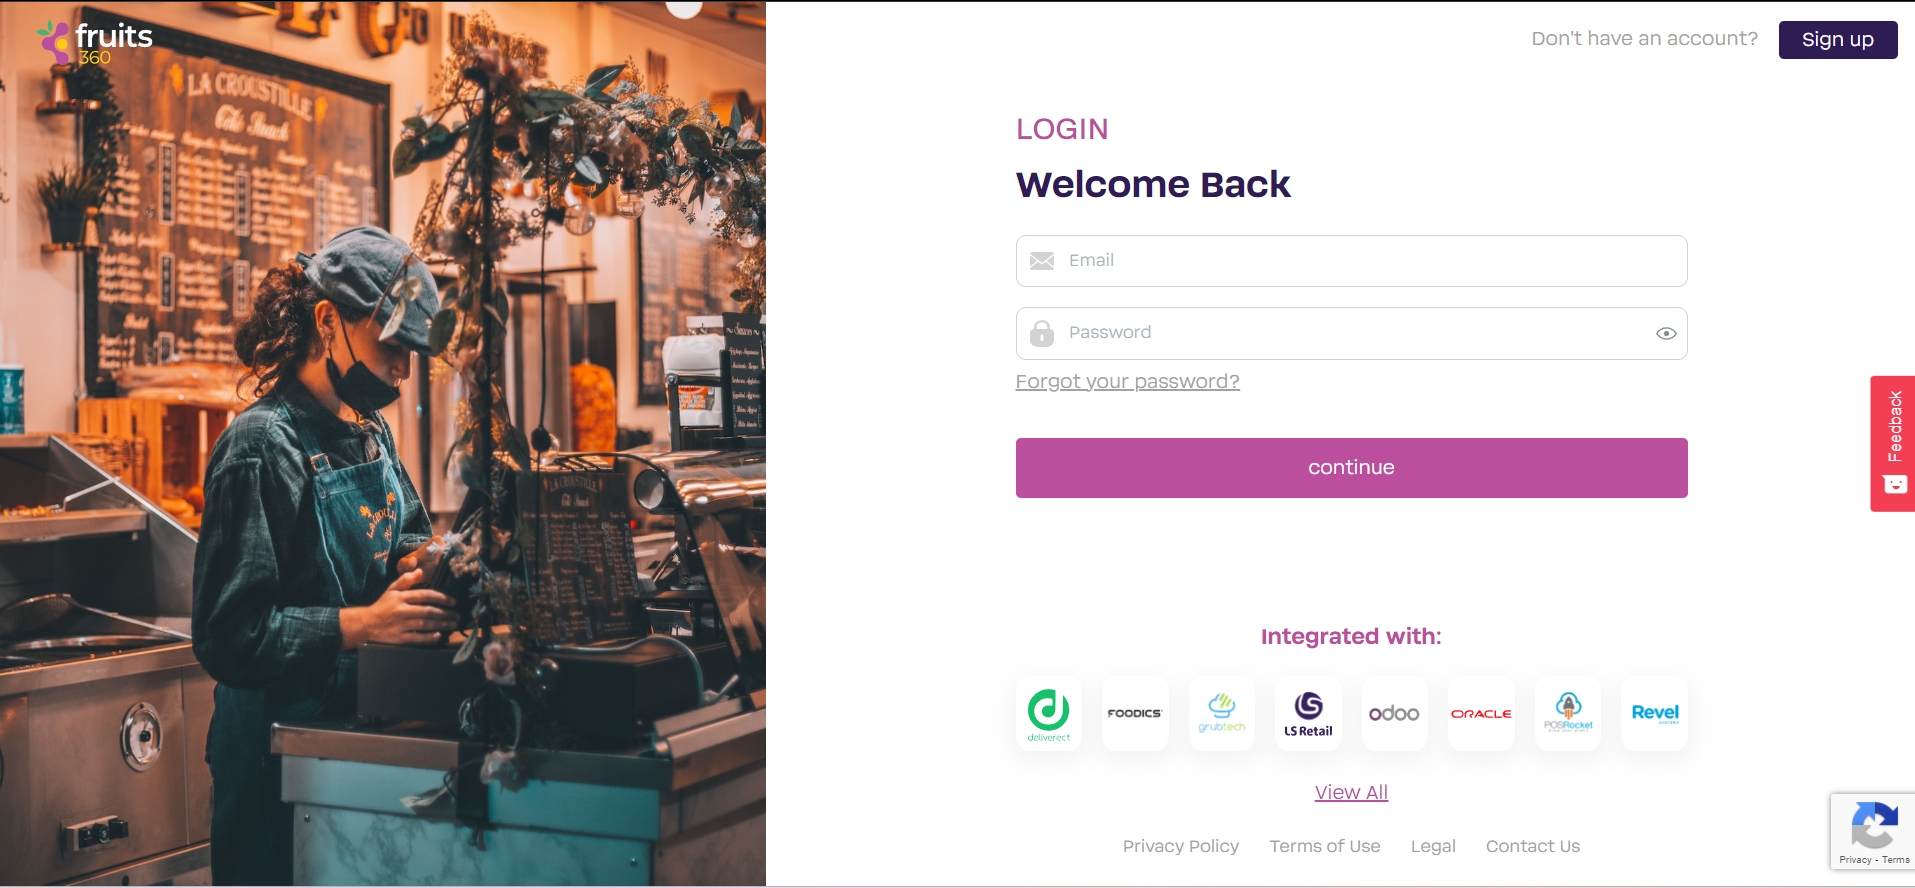
Our integrations
- Foodics
- Oracle Micros (Simphony)
- Revel
- Marn
- Odoo
- LS Retail
- Posist
- Deliverect
- Grubtech
- Otter
Integration Method
Our integration method involves leveraging APIs to connect our product with partner systems. Partners provide API documentation and grant us access to demo accounts or sandbox environments for integration testing. Once the integration is successful, we onboard our clients to the solution. Following the integration, partners list our product in their marketplace, allowing customers to seamlessly utilize our offering.
Client Enablement/ Onboarding
At Fruits360, we tailor our client enablement and onboarding process to cater to different integration methods, offering two approaches based on the selected method:
Seamless Enablement: If Fruits integrates with the partner using Auth2, the customer can enable the connection using the POS marketplace. This is done through Fruits360’s integration page directly. Simply visit our integrations page and select your POS to complete the enablement.
Manual Enablement: If the enablement reuiresmore information/details, like a specific secret key, or any extra information from the customer or the partner, Fruits360’s support and sales team will support during this process. Overall, the customer will receive full support from Fruits360’s team for enablement once they have access to the Fruits360 demo account and reach the integration page to see the details for each integration and how to integrate with us.
After Enablement
Upon completion of the enablement process, the customer will promptly receive a notification and email informing them that their account is being set up. During this time, the customer gains access to a demo account, allowing them to explore the product’s insights and become familiar with its features. The enablement process is swift, as we efficiently process the latest three months’ data, enabling customers to view real-time information instantly. In just a few moments, the customer will have access to the complete historical data, providing them with a wealth of fruitful insights to leverage.
Targeted Market
Competitive Analysis
How to Use the Product
Installation Instructions
Setup and Configuration
User Guide
Landing Page
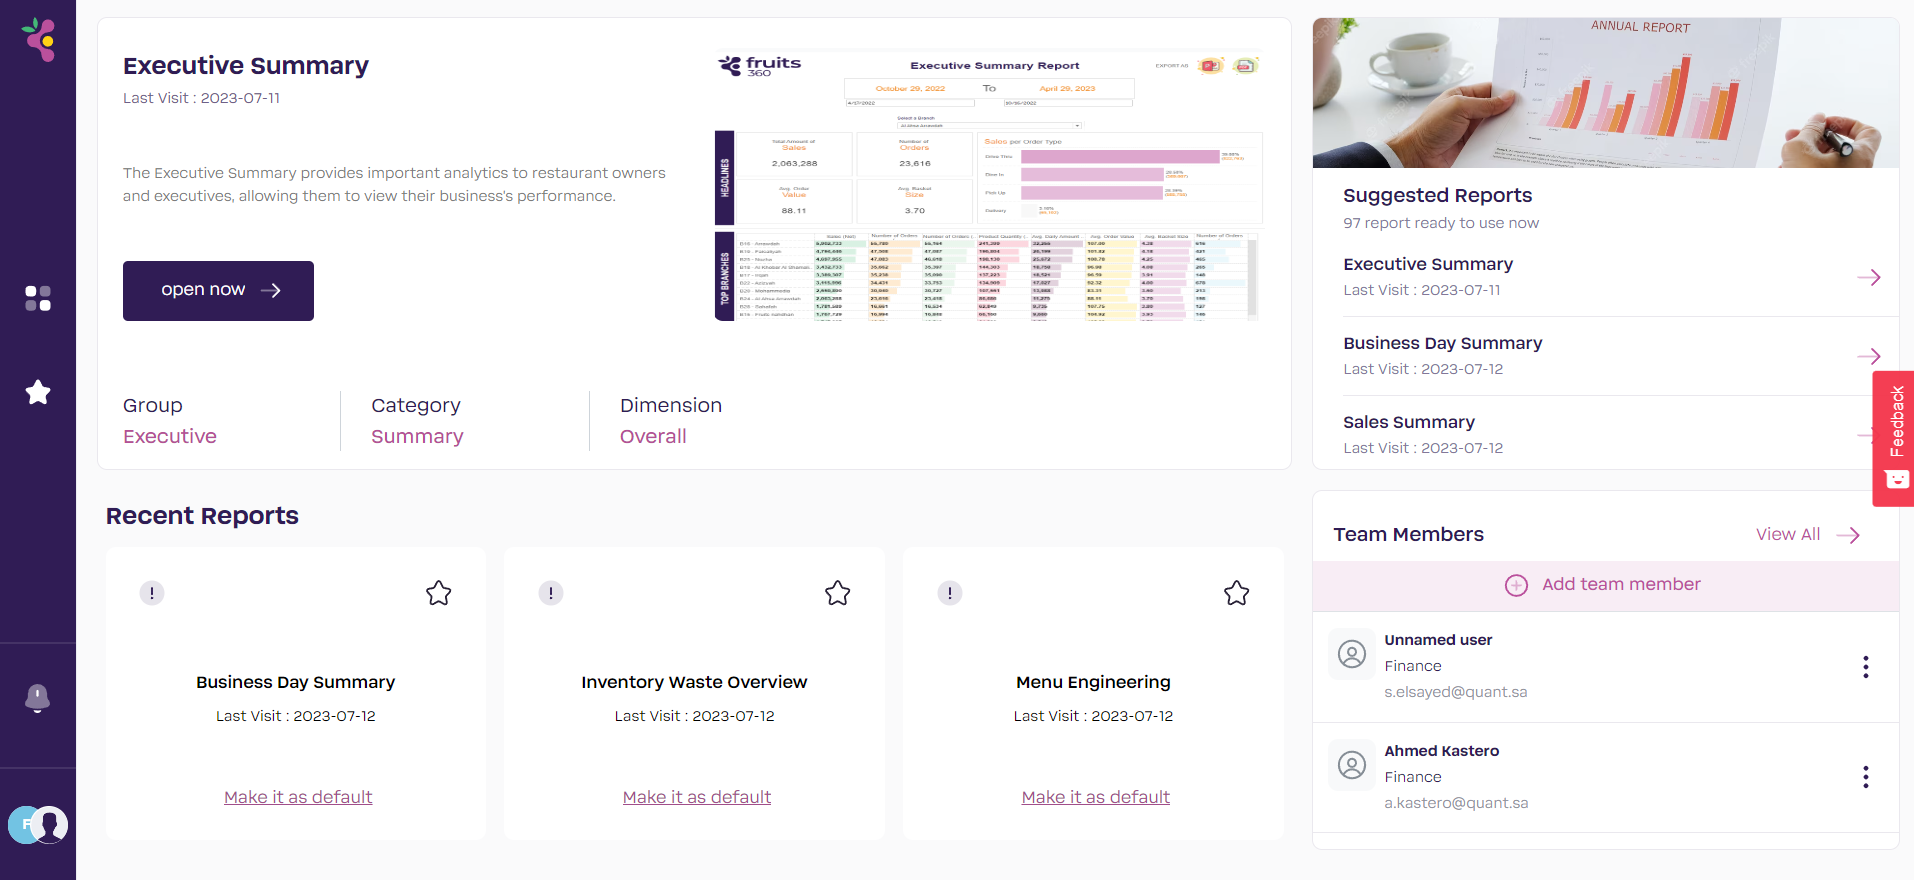
1. Home Page

2. Report Page
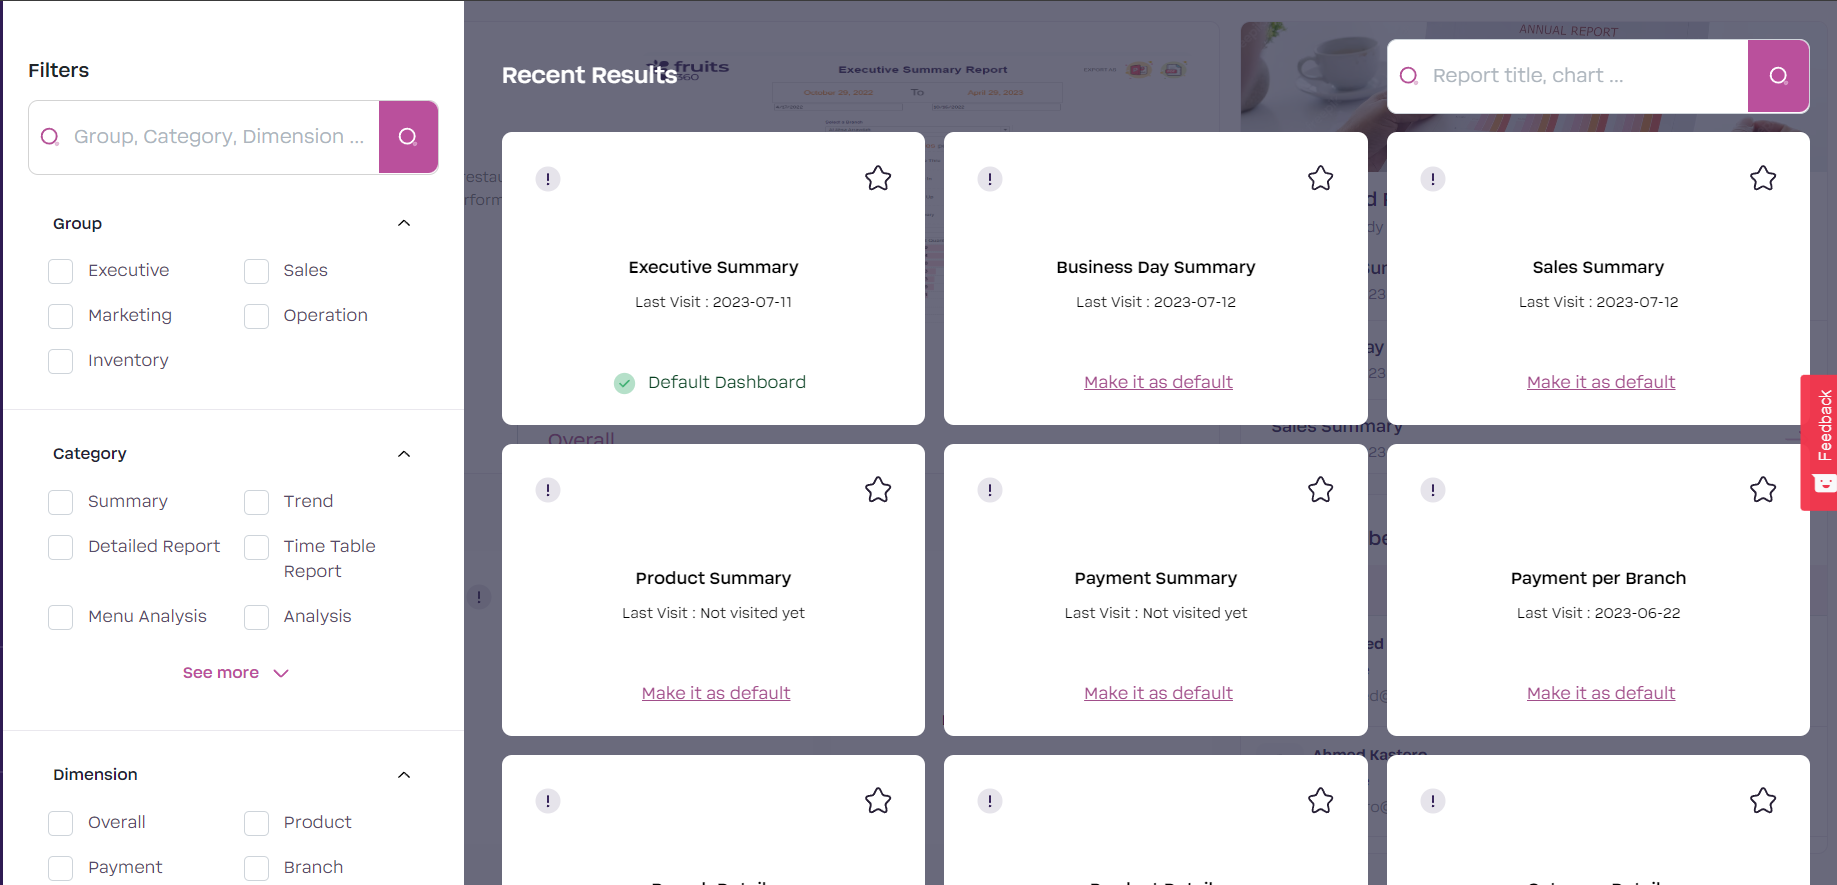
Report Page Component
- Navigation filters part: you will be able to search based on a Group, Category and Dimension.
- Group: At the heart of our system, this module organizes a collection of dashboards and reports. Upon clicking on any group, the report and dashboard canvas will automatically filter to present the related reports, streamlining your access to valuable insights.
- Category: This feature efficiently organizes reports and dashboards based on their specific types and formats, streamlining the presentation and navigation for a more user-friendly experience.
- Dimension: This feature enables you to select the level at which you prefer to view the reports and dashboards. For instance, you can choose to focus on branch level, category, product, customer, inventory item, or time level for a more tailored and insightful analysis.
- Additionally, if you know the name of the dashboard or report, you can quickly locate it by using the search icon located at the top right corner.
3. Favorite
4. Notification Center
5. My Setting

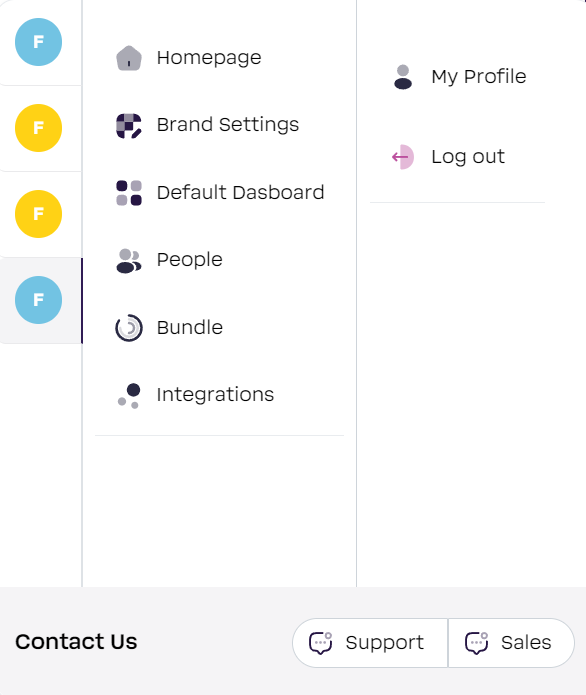
6. Default Dashboard

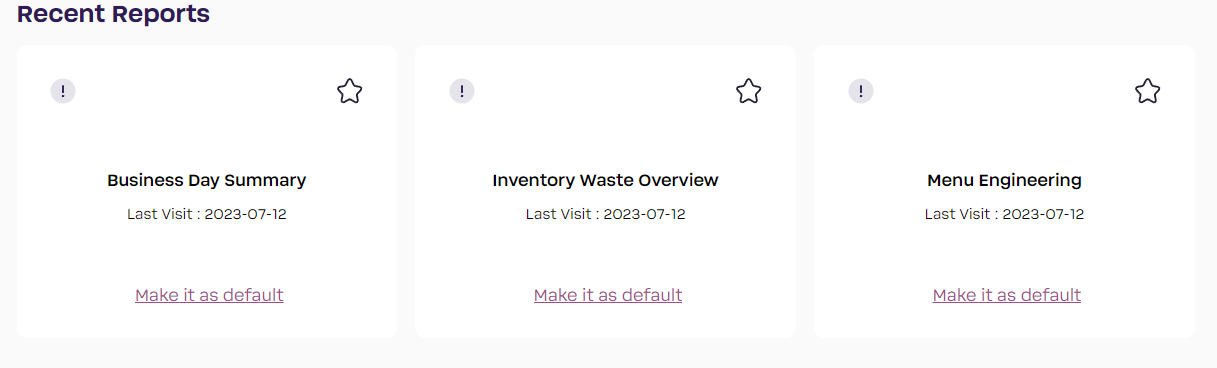
7. Recent Report
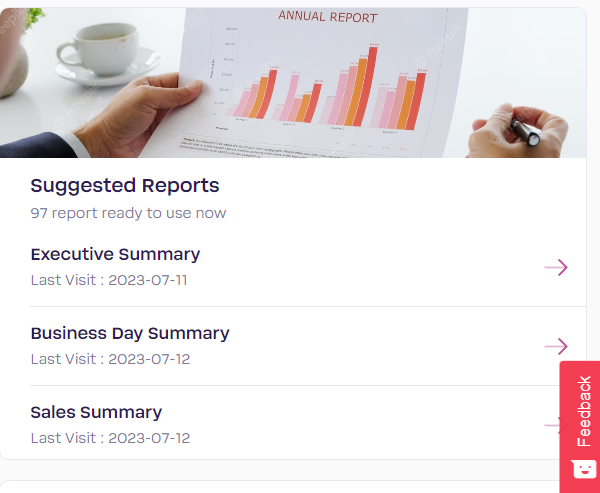
8. Suggested Report
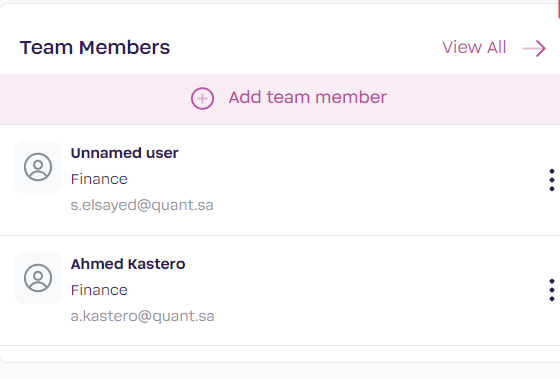
9. Team Members
10. Browsing a Report or Dashboard
- Filters: When you click on any of the filters located at the top of the dashboard or report, a drop-down list of options will appear. By selecting or removing a value from the filter, the changes will be instantly reflected on the report or dashboard, providing real-time updates to suit your needs.
- Report / Dashboards: Below filters, you will find the reports or dashboards that provide you with the most essential and valuable insights.
- Export : In the top right corner, you’ll find the export button where you can export dashboards in different formats (Image, PDF and Crosstab (Excel or CSV)).

- Info: The info button in the top right corner provides more information on the dashboard you’re viewing.

Frequently Asked Questions (FAQs)
Data and Security
- Who can see my business data? The user with Company Owner access can grant access to others within the company through the platform. Other than that…no one!
- How often is the data refreshed? We automatically import your POS data once a day.
- Can I export all my data at once? Data export for individual insights is always available in several formats. However, if you would like to export your data in bulk, please Contact Us for a quote.
- Is my data safe? We host your encrypted data in a stand-alone cloud database for top notch security and peace of mind.
- Will my data get used in future aggregated analysis? Your anonymized data is used by our R&D department to develop new insights and features only.
Platform
- Does your platform integrate with other software and tools? Fruits360 integrates with a variety of tools and software, making it easy to manage your restaurant. Check our Integrations *link* page for options, or fill out a Partner Request *link* if you don’t see the tool you’re looking for.
- Can I open Fruits360 on multiple devices? Fruits360 can be accessed by any browser which allows you to access it using your preferred device for convenience.
- Are the insights available from a mobile device? The in-depth nature of our platform means that you’ll be able to adjust and view reports much more reliably on a laptop or desktop. However, there’s nothing stopping you from opening Fruits360 in a mobile browser.
- Can Fruits360 analytics track customers’ gender? If your POS tracks gender, we can display it in your insights.
- What are the different permissions levels?
- Company Owners: Add other users and set their permission level.
- Dimension Editor: Edit/update the dimensions from the central panel, plus view access.
- Regular User: View and browse the dashboards.
- Can I add product KPIs on Fruits360 and track their progress? Any admin can customize the company insights from the control panel. Add targets for each branch or product and monitor their performance.
- Can I view my data in real time? Due to aggregation and data processing going on in the background, the most recent data available to you is for yesterday’s data.
- Will I be able to export my insights in any format? You can export any insights into PDF, PowerPoint, Excel, or image. This makes it easy to pass data on to your finance team or use in a presentation.
- Do Fruits360 users need to have technical skills? As long as you can open a browser and log in, you’ll do fine! Our dashboards were created by data scientists so you don’t have to be one. Our customer service team is available if you have any questions as well.
Sign Up
- What is Fruits360? Fruits360 is a BI and analytics product that connects to restaurant management systems to provide advanced analytics and a comprehensive overview of your business. It enables you to extract actionable insights to grow your business in the right direction- based on data, not guesswork.
- How long does it take to connect my integrated POS account to Fruits360? Connection is instantaneous! You’ll be able to view recent data within a few hours. Historical data may take 5+ days depending on the amount of data you have.
- Can I get more information to share with my organization? Contact our sales team and they’ll provide a company profile for you to share.
- Do you offer a demo or appointments to talk one-on-one about my questions? Sure! Schedule a demo with one of our friendly sales people. They’re happy to answer any questions you have about your use case.
- I do not see my POS in the **Partner POS** list, can you integrate with it? We can integrate with any cloud-based POS. Fill out the form **here** to request the integration. To make sure the platform is right for you, you’ll be able to view demo data in the meantime.
- How can I contact the sales team? Just fill out this form and we’ll be in touch.
- How can I connect my POS to Fruits360? Simply start your Free Trial or sign up for a paid plan. You’ll be able to select your POS and we’ll guide you through connecting it with your POS credentials.
- Can I get a trial account? Yes! If you your restaurant management system is listed on our Integrations page, we’ll **connect your account** and get you going with real live data! If your POS isn’t yet integrated, sign up to view our software with demo data. If you love the platform, we can usually enable a new POS Partner within a few months.
Subscription
- How do I renew my subscription? Billing is handled automatically every year. You’ll receive an invoice at the time of billing.
- Will I lose my data if I do not renew my subscription? Your data will remain hosted under your account, but the access will be disabled until you renew the subscription.
Support & Training
- Do you have an online guide so I can learn about the features? Check out all of the **How To Videos** we have available. A Customer Success Agent will also be assigned to you to get you started.
- Will there be personalized training on how to use Fruits360 after I subscribe? After your paid subscription begins, our customer success team will schedule a training session with you and your team. You’ll get your questions answered and learn how to deep dive into the software.
- What are your customer support hours? We have a helpful support team working 5 days a week from 9 AM to 6 PM KSA local time.