Data-Driven Decisions: The 4 Essential Reports For Resturant Managers
In a cutthroat and highly competitive market, restaurant success requires the perfect balance between quality offering and operational efficiency– and to that end, no restaurant manager will ever run out of reasons or ways to improve their profit margins. But with a wide and endless list of customers to track, products to evaluate and inventory to manage, how do decision-makers in the F&B market begin to interpret the data and make the right choices to a better bottom line?
The truth of the matter is, running a successful restaurant is more than creating a great menu and hiring a fantastic staff; it’s also necessary to understand the numbers behind your operation. In this blog post, we will discuss some of the most common questions that restaurant managers and supervisors have about restaurant analytics and how to answer them with data. We’ll also look at the fundamentals of data-driven reporting that ultimately unlocks optimal growth.
First: Daily Tasks to Keep Track of
Make a goal to run the following list of reports each day. Once you’ve run them, sit down and take a short amount of time to review them. Take note to highlight any numbers that seem off or stand out to you. We’re going to share the exact steps needed to take to make your data work for you. You’ll be making better decisions in no time!
1. Sales Report: This report shows the total sales for the day, broken down by order type (Delivery, Take out, Dine in, etc.) and employee.
2. Labor Report: This report shows the total labor costs for the day, broken down by employee and job function (server, cook, etc.). It helps managers evaluate staff performance and determine staff scheduling.
3. Refund Report: This report shows any refunded transactions for the day, including the reason for the void or refund. It helps managers identify potential issues with menu items, staff training, or customer service.
4. Discount Report: This report shows any discounts applied to transactions for the day, broken down by employee and reason for the discount. It helps managers evaluate how effective discounts are by tracking how much new or retained customers are using them and ensure they are being applied appropriately.
5. Inventory Report: This report shows the inventory levels for the day, broken down by item and location. It helps managers track inventory levels and identify potential issues with theft or waste.
6. Customer Reports: Customer reports include a range of crucial information that will uncover the types of customers you attract, how much it costs you to acquire new customers as well as how often customers repeat their visits and their activity levels.
Common Question: “How can I decide to take an item off the menu”?
There is no one-size-fits-all formula for determining which items should be removed from your menu. There are several factors to consider when deciding which items to remove from your menu, including sales data, customer feedback, cost of ingredients, menu focus, and seasonal availability.
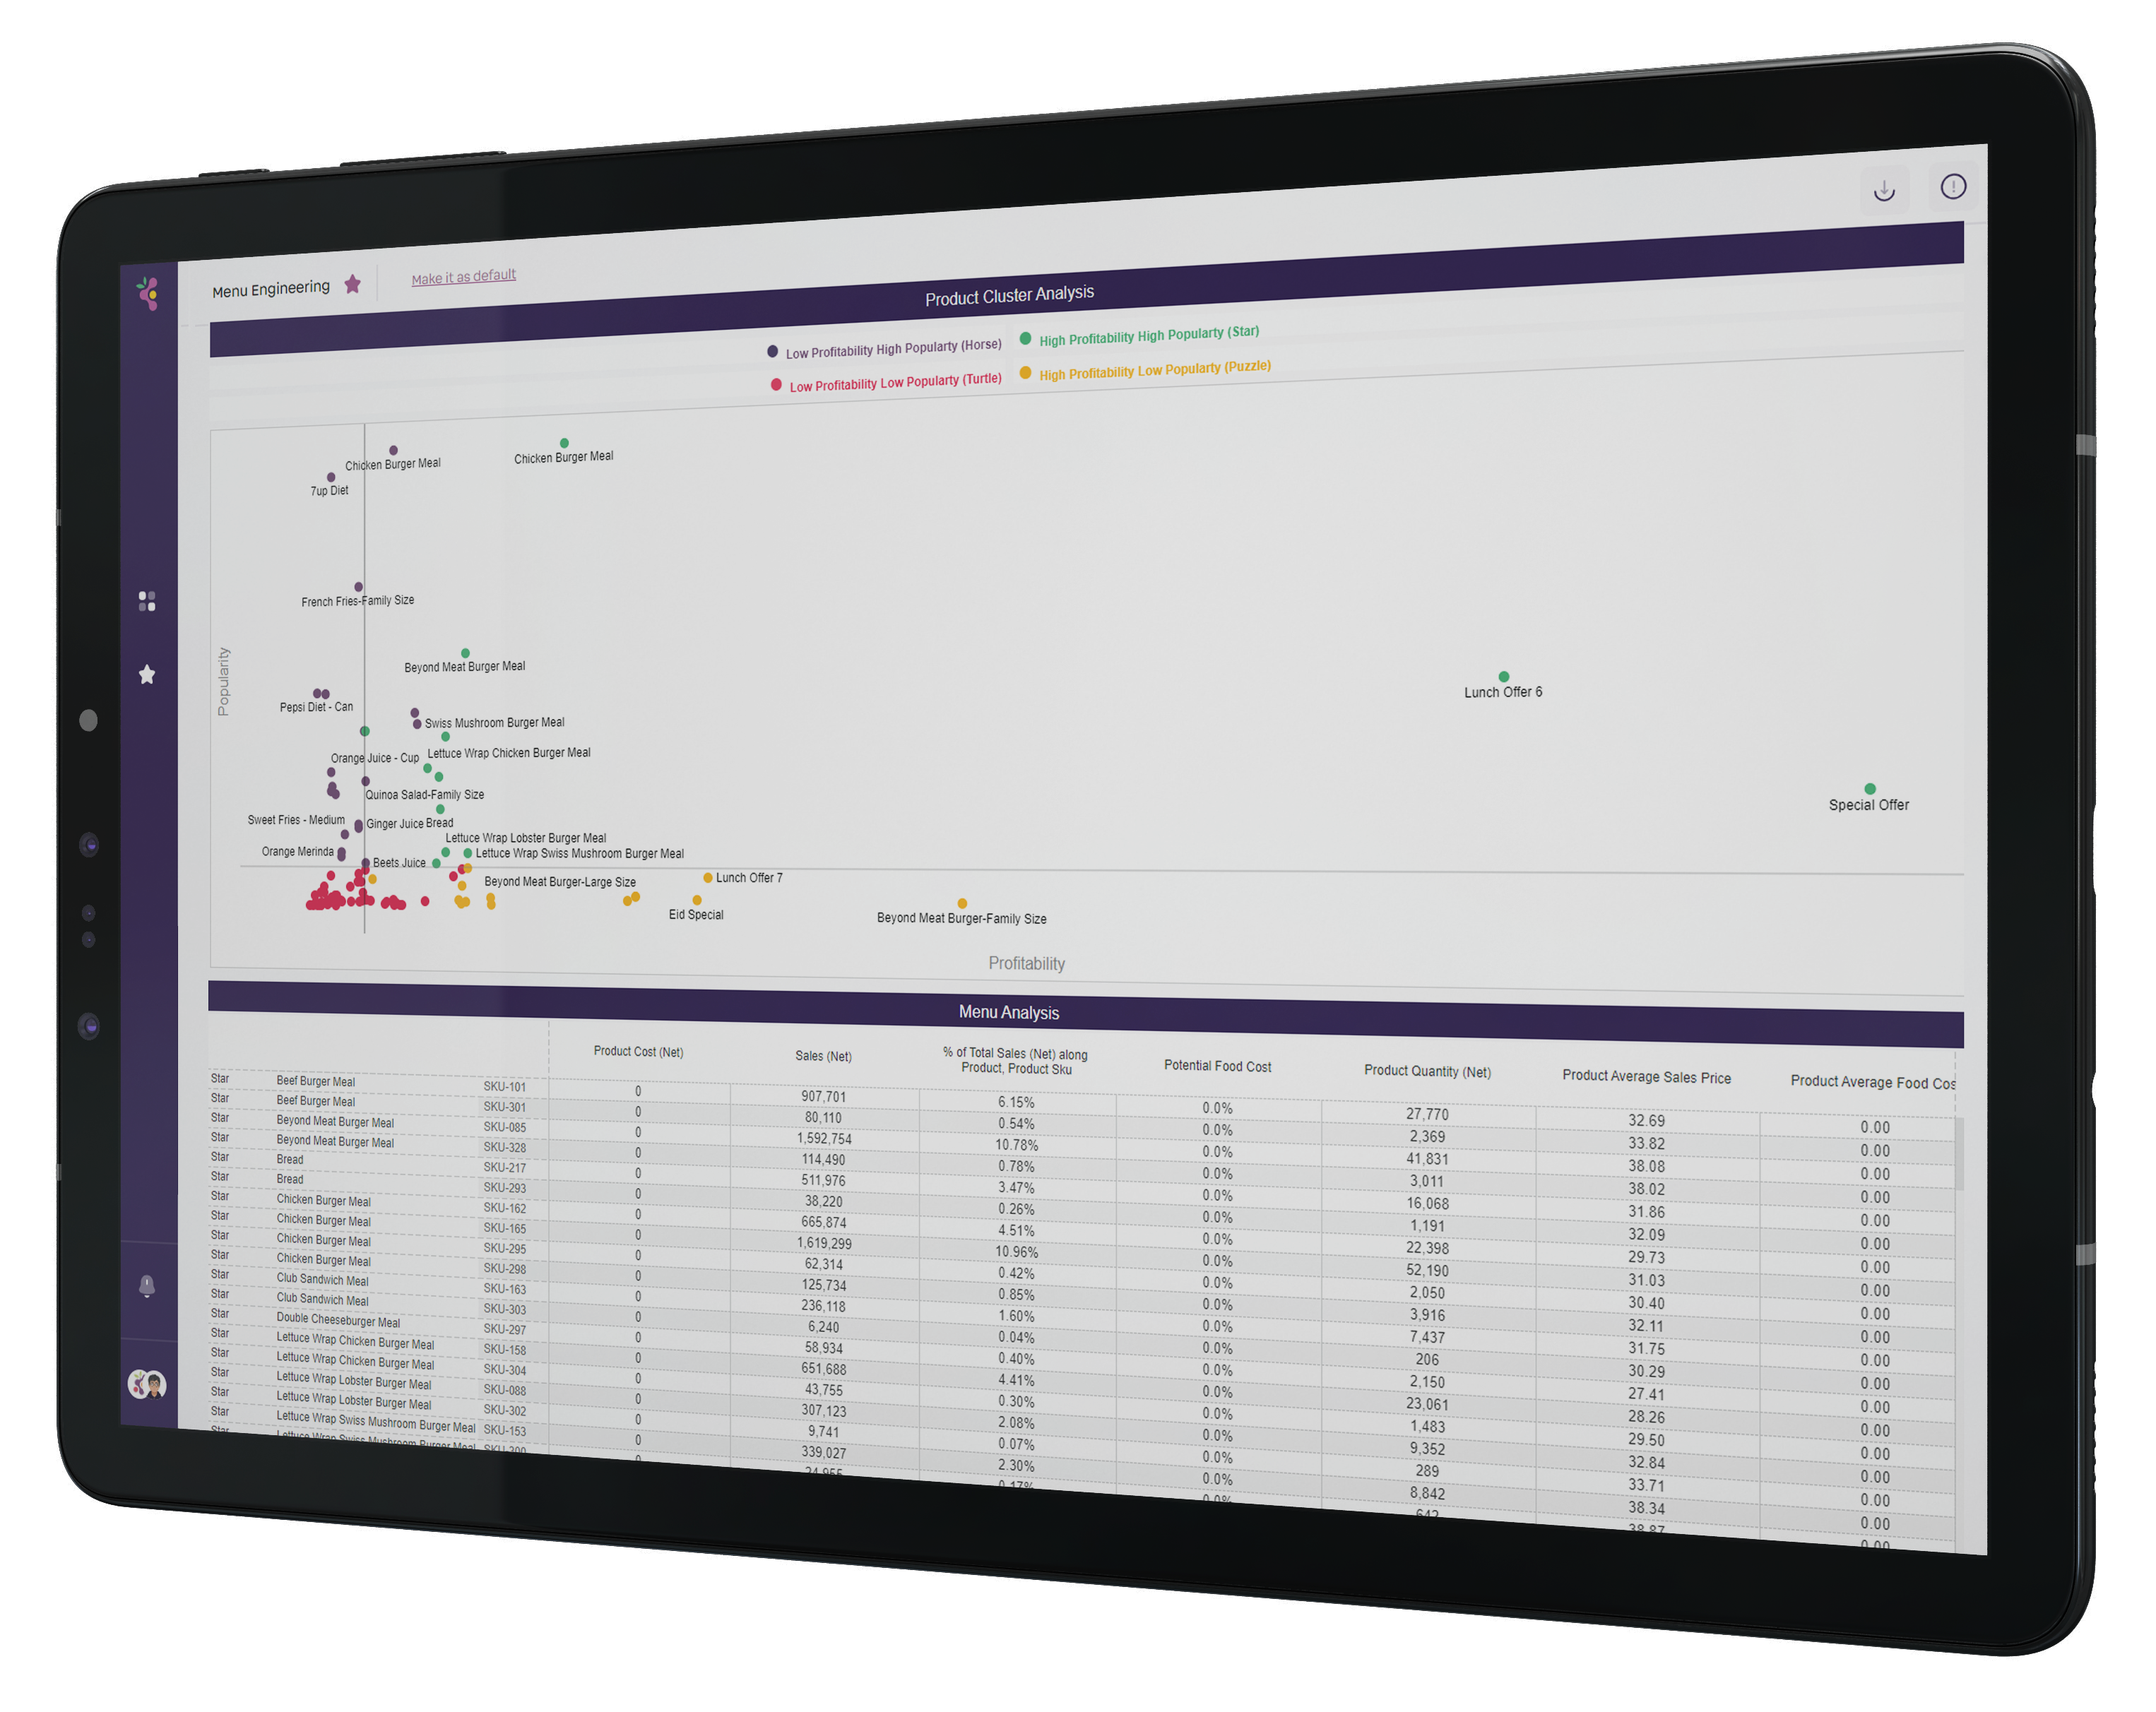
Using Menu Engineering, you can identify menu items that are not selling well and how to better their performance or remove them. The menu engineering matrix can point you toward particular menu items that are costly to produce and not very profitable which may be worth removing or making some changes to improve them. Eliminating items that are subject to seasonal availability may provide a streamlining benefit to the organization as well.
A restaurant may choose to remove menu items that do not align with its overall concept or theme to create a more cohesive and consistent dining experience for customers. Finally, a restaurant may remove menu items that are only available seasonally to streamline the menu and reduce waste.
Your Quarterly Task #1: Run a Menu Engineering Report
Lowest Selling Items
Run a Menu Engineering Report to highlight your lowest-selling items and compile them. Go ahead and collect additional data on customer feedback, ingredient cost, menu focus, and seasonal availability for these items. Review with your team to determine which items should be removed from your menu.
Highest Selling Items
The Menu Engineering report highlights your highest-selling items. Discuss promotional opportunities with your marketing team. Review the item cost to determine if the price could be increased. Talk with your team about other opportunities listed above, and if they’re a good fit for any popular products.
For a more detailed understanding of Menu Engineering and how it can help optimize your menu, click here.
Common Question: “What should restaurant managers do with items that sell well”?
Food flying off the grill as fast as your back-of-house staff can make it? If you’ve found signature products that are popular with customers, there are several things you can do to capitalize on their popularity. For example, highlighting popular items on the menu makes them even more appealing to a wider range of customers. Consider using marketing resources to drive sales even further.
If an item is consistently selling well and has a high-profit margin, you can even consider slightly increasing the price without negatively impacting sales. Offering popular menu items as a special combo deal or a limited-time offer can also be a great way to encourage customers to purchase more items and increase overall sales.
You can also encourage staff to suggest popular menu items as add-ons or upgrades to other menu items to increase sales. Finally, if a particular menu item is extremely popular, you may want to consider adding similar items to the menu to capitalize on the demand.
How can I better manage restaurant labor costs?
The labor report shows the total labor costs for any given day. By analyzing the labor report, managers can identify trends in staff productivity and performance, and make decisions about training or performance improvement plans. Managers can use the labor report to identify the busiest times of day and ensure that there is enough staff scheduled to meet customer demand. By analyzing the labor report, managers may be able to identify opportunities to reduce labor costs, such as by implementing more efficient processes or adjusting staffing levels.
For example, after analyzing the labor report for the past week, the restaurant manager, Ahmed, noticed that one of the servers, Fatima, had consistently taken longer than average to complete her tables. Upon further investigation, Ahmed discovered that Fatima had not been properly trained on the restaurant’s POS system, and was taking longer to input orders and process payments. Ahmed decided to provide additional training to Fatima on the POS system, and also set up a system for tracking and monitoring staff performance to ensure that all servers were meeting the expected productivity levels.
As a result of this training and performance tracking, Fatima’s table turnaround times improved, and the restaurant was able to operate more efficiently and effectively. It’s important to note that making decisions based on a single day’s labor report may not provide a complete picture, and it may be necessary to analyze data over a longer period to make more informed decisions.
Your Quarterly Task #3: Run a Labor Report
Review your *labor report* for the past quarter. Next, identify trends in staff performance and determine if any additional training or performance improvement plans are needed. Identify the busiest times of day and ensure that there is enough staff scheduled to meet customer demand. Identify any opportunities to reduce labor costs and implement them if possible. Use these indicators to determine your best and worst-performing branches and evaluate the possible causes and replicate successful businesses approaches across different locations.
“How can I use food reports to identify opportunities for cost saving”?
The key to reducing waste is to track a few metrics that pinpoint you to where possible cost saving could happen. The cost report shows the total cost of ingredients used in menu items, as well as the percentage of total sales that these ingredients represent. To identify opportunities for cost saving, look for discrepancies in pricing, supplier performance, or fluctuations in ingredient costs. Examine your inventory reports to identify any excessive stock levels, slow-moving items, or items that frequently go to waste. It can help managers identify opportunities to reduce food costs and increase profitability.
Your Quarterly Task #4: Run an Inventory Report
As a restaurant manager, it’s important to keep a close eye on inventory stock levels to ensure that you’re using ingredients efficiently and not wasting valuable resources. This is where inventory reports come in. By analyzing different inventory reports, like the Food Waste, Stock Levels and Item Forecast reports, managers can identify any shortages or excesses that need to be addressed, adjust prep levels accordingly, and track the expiration dates of perishable ingredients to reduce waste. Additionally, the inventory report can help managers determine daily specials or combo deals that use excess ingredients, plan for the next day’s menu, and identify opportunities for cost savings such as negotiating better pricing with suppliers. By utilizing the inventory report effectively, restaurant managers can improve efficiency, reduce waste, and ultimately boost their bottom line.
How can I use the results of my marketing report to influence my social media strategy?
Marketing reports provide insights into consumer behavior and preferences, which can be leveraged to develop a successful marketing strategy. Reports into customer acquisition, segmentation, retention, and demographics unlock valuable information that can be used to optimize menu offerings and create a tailored experience for customers.
Here are some key metrics and data typically found in marketing reports:
- Key Acquisition Channels
- Retention Rates
- Customer Engagement Rates
- Customer Activity
- Ordering Frequency
Your Quarterly Task #4: Run a Marketing Report
This report tracks the effectiveness of marketing efforts, such as social media campaigns or email marketing, and can help managers identify opportunities to reach more customers and drive sales. Run this report and analyze any trends currently present based off of the current advertising you are conducting. Go ahead and adjust social media content If the marketing report indicates that a particular social media post or campaign was particularly effective, the restaurant can consider creating similar content to continue driving engagement and sales.
If you are running targeted social media ads, the marketing report can help you identify which social media ads are most effective. You can use targeted social media ads to promote the day’s specials and drive traffic to the restaurant.
You’re now well-aware that understanding and utilizing data will help you make informed decisions about menu items, pricing, staffing and marketing. By running daily reports such as the Sales Report, Labor Report, Void/Refund Report, Discount Report, and Inventory Report, you can stay on top of your numbers and identify areas for improvement.
By taking advantage of your restaurant data, you can make better decisions that will improve your restaurant’s profitability. If you’re ready to take your restaurant to the next level of sales and profitability, Fruits360 is here to provide you with user-friendly plug and play analytics services that will help you identify areas for improvement and capitalize on your successes.\
Your Menu Engineering Report on Fruits360
Menu Engineering

Your Labor Report on Fruits360
Cashier Summary
Your Marketing Reports on Fruits360
Purchase Behavior

Unlock the power of actionable business intelligence insights by registering with Fruits360 today, and gain access to 100+ visualized reports here (Link: https://dashboard.fruits360.io/request-demo?lead_source=Request%20Demo).
